Choose Your Northstars.Get Your Two-Year Roadmap.Know Who Does What Weekly.
Most executives balance profit AND revenue. Or margin AND customer satisfaction.CausalBeacon shows you exactly which initiatives move YOUR metrics— and delivers concrete quarterly plans with weekly task assignments.
Free Performance Optimization Workshop
Get a complimentary 2-hour engagement where we analyze your operations data and identify your top 3 improvement opportunities—quantified in dollars.
Initial causal analysis
of your data
Quick wins report
3 highest-ROI actions
24-month projection
Performance roadmap
Available to companies $10M-$1B+ revenue across manufacturing, SaaS, distribution, construction, ecommerce, and healthcare • Requires c-suite participation • No commitment required
Choose Your Northstars
You don't optimize for one metric. You balance 2-3 competing goals.
Select what matters most to YOUR business—we'll show you how to improve all of them.
Profitability
Choose how you measure profit:
- EBITDA (Earnings Before Interest, Taxes, Depreciation, Amortization)
Most common for PE-backed companies and manufacturers
- Operating Profit / Operating Income
Focus on core business operations profitability
- Net Income / Net Profit
Bottom-line profit after all expenses
- Gross Profit / Gross Margin %
Direct product/service profitability
- Contribution Margin
Common for ecommerce/SaaS unit economics
Growth & Revenue
Balance profit with growth:
- Total Revenue / Revenue Growth %
- ARR (Annual Recurring Revenue) — SaaS
- Revenue per Employee
- Average Order Value / Deal Size
- Market Share Growth
Operational Excellence
Drive efficiency:
- OEE (Overall Equipment Effectiveness) — Manufacturing
- Inventory Turns — Distribution
- Project Delivery Time — Construction
- Defect Rate / Quality Score
- On-Time Delivery %
Customer & Market
Balance short-term profit with long-term value:
- Net Promoter Score (NPS)
- Customer Satisfaction (CSAT)
- Customer Lifetime Value (LTV)
- Net Revenue Retention (NRR) — SaaS
- Churn Rate / Retention Rate
Example Configurations
What You Get
Not just analytics. A complete action plan with timelines, owners, and financial impact.
Choose Your Northstars
Select 2-3 weighted metrics that matter most. Examples:
- • Operating Profit (50%) + Revenue Growth (30%) + NPS (20%)
- • Gross Margin (60%) + Inventory Turns (25%) + Fill Rate (15%)
- • Net Income (40%) + ARR (35%) + NRR (25%)
Understand Causal Drivers
See exactly which operational levers move each northstar:
- • "1-point gross margin improvement = +$240K annual profit"
- • "5-point OEE increase = +$180K profit + 8% more capacity"
- • "Reducing defects 2% = +$95K profit + 0.3 NPS improvement"
Two-Year Action Roadmap
Concrete quarterly initiatives with timelines and impact:
- • Q1 2025: Materials cost reduction program (+$420K)
- • Q2 2025: OEE recovery through TPM (+$680K)
- • Q3 2025: Pricing discipline rollout (+$320K)
- • Q4 2025: SKU rationalization (+$290K)
Weekly "Who Does What"
Specific task assignments with accountability:
- • Procurement: Renegotiate top 5 suppliers by Mar 15 (+$87K)
- • Plant Mgr: Implement TPM pilot on Line 3 by Feb 28 (+$52K)
- • Sales Ops: Update discount matrix by Jan 31 (+$34K)
Complete Action Plan Includes:
Timelines
Quarterly milestones, monthly check-ins, weekly tasks
Owners
Clear accountability: Procurement, Plant, Sales, Finance
Impact
Financial impact per initiative (e.g. "+$420K EBITDA")
See It In Action
Inside the Manufacturing Demo
Explore real causal analysis dashboards, OKR roadmaps, and actionable recommendations. No signup required.
Management Consulting 2.0: Software-Scale Economics
Traditional Consulting
- $200K-$500K per engagement
- 8-12 weeks for analysis
- One-time project (static PowerPoint)
- Varies by consultant (inconsistent)
CausalBeacon
- $10K+ setup + $1,500/month for full executive suite
- 2 weeks analysis + minutes for insights
- Monthly/quarterly refresh + real-time what-if
- Consistent methodology + expert-validated
Analytics Tools Only
- Show data but no causal insights
- You decide what actions to take
- No roadmap or weekly task assignments
- Generic dashboards (not action-oriented)
"Consulting-grade causal analysis at software-scale economics."
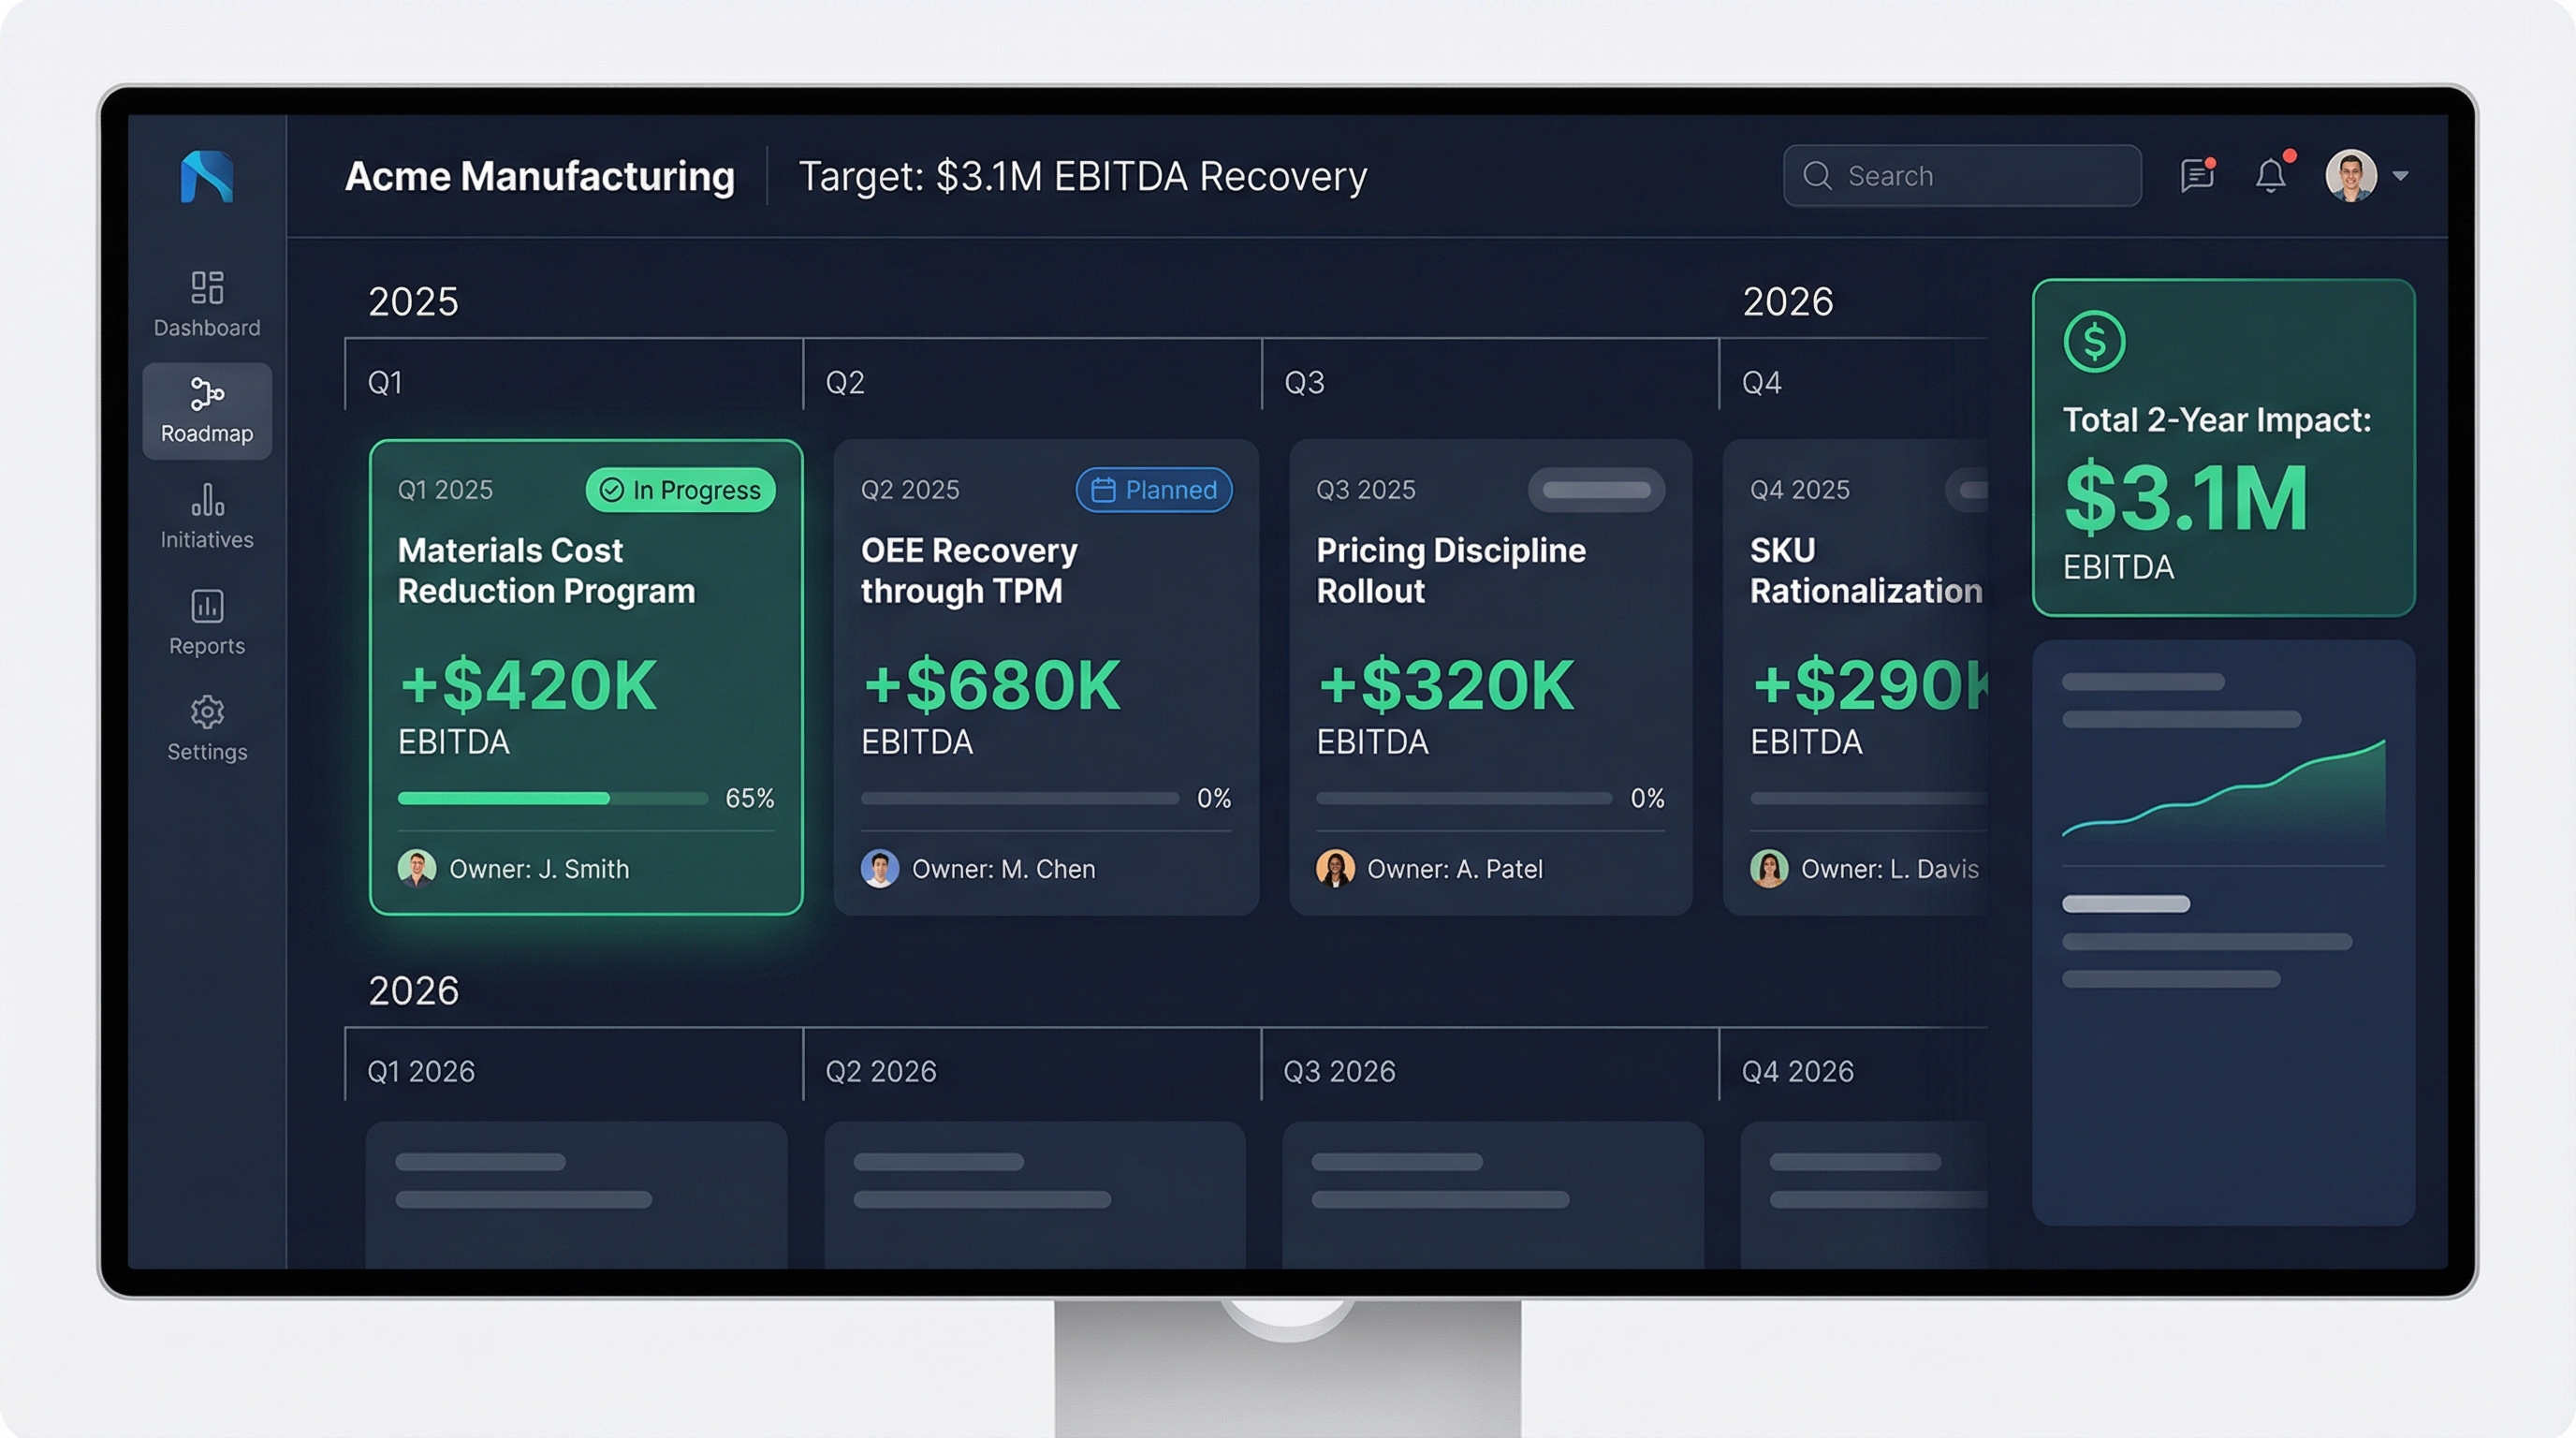
Two-Year OKR Roadmap
Not just insights—a complete action plan. See quarterly initiatives with specific timelines, owners, and financial impact. Example: "Q1 2025: Materials cost reduction (+$420K EBITDA)"
- 47 specific weekly tasks assigned to Procurement, Plant Manager, Sales Ops, Finance
- Quarterly milestones with clear accountability
- Total $3.1M EBITDA recovery roadmap
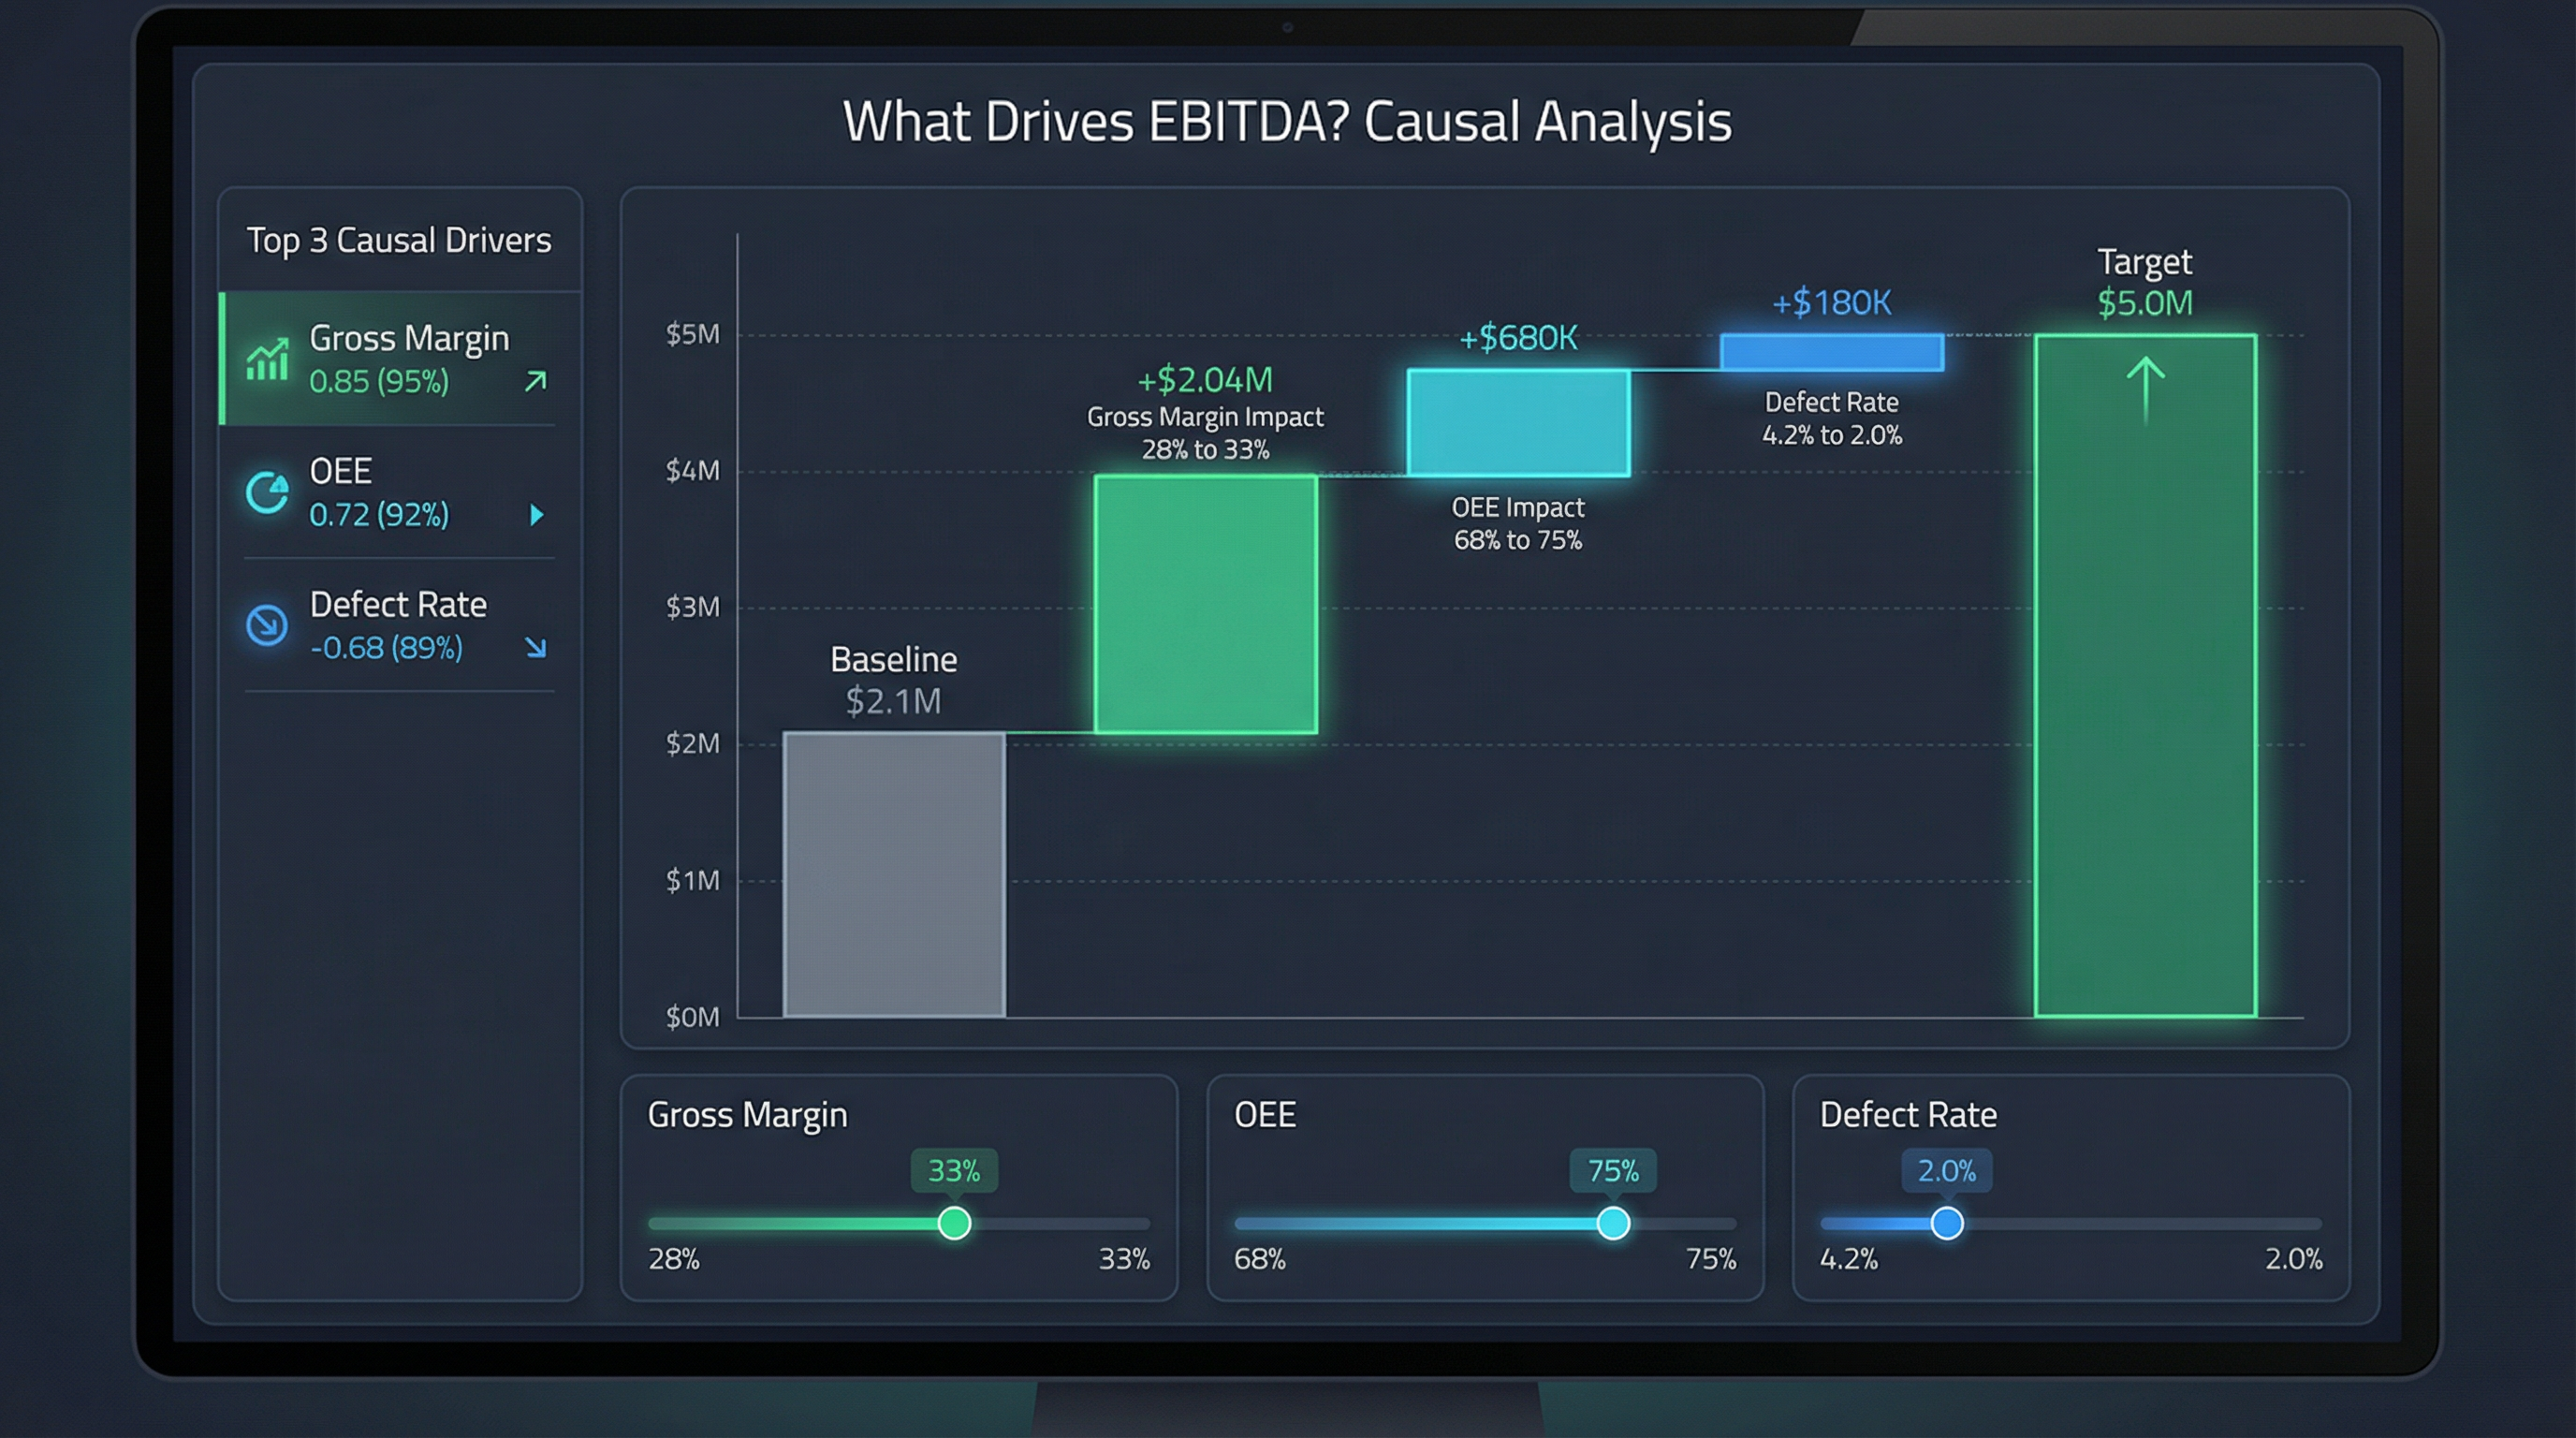
Causal Impact Analysis
Understand exactly how each operational metric affects your northstars. Not correlations—causal relationships validated by experts. Example: "1-point gross margin improvement = +$240K annual profit"
- Quantified relationships between operations and EBITDA
- Interactive what-if scenarios with confidence intervals
- Expert-validated coefficients (no LLM hallucinations; deterministic calculations)
Not Just an Analytics Tool—An "All Hands On Deck" Execution Platform
Choose Your Northstars
Balance 2-3 competing goals (EBITDA + OEE + NPS)
Understand Causal Drivers
See which operational levers move each metric
Execute with Your Team
Weekly tasks with clear owners and deadlines
Industries We Serve
Six Industries. One Platform.
Tailored northstar configurations and actionable roadmaps for your industry.
Manufacturing
$10M-$500M+ Revenue | Discrete & Process Manufacturing
Typical Northstars:
- •Operating Profit / EBITDA (50%)
- •OEE - Overall Equipment Effectiveness (30%)
- •On-Time Delivery / Customer Satisfaction (20%)
Key Causal Drivers:
- Gross Margin % (materials, labor, yield)
- OEE (availability, performance, quality)
- Defect/Scrap Rate
- Revenue per Employee
- SG&A as % of Revenue
Example Result:
Medical equipment manufacturer, $21M revenue
$3.1M profit recovery in Year 1
through materials cost reduction ($420K), OEE improvement ($680K), pricing discipline ($320K), and SKU rationalization ($290K). Two-year roadmap with 47 specific weekly tasks assigned to Procurement, Plant Manager, Sales Ops, and Finance.
Software / SaaS
$5M-$100M+ ARR | B2B & B2C SaaS
Typical Northstars:
- •Net Income / Operating Profit (40%)
- •ARR Growth % (35%)
- •Net Revenue Retention (25%)
Key Causal Drivers:
- CAC Payback Period
- Gross Margin % (COGS optimization)
- Net Revenue Retention (NRR)
- Sales Efficiency (ARR per Sales Rep)
- Churn Rate
Example Result:
B2B SaaS, $12M ARR
40% ARR growth while reducing monthly burn rate 35%
through CAC optimization (shortened payback from 18mo to 11mo), expansion revenue program (NRR from 95% to 118%), and COGS reduction (margin from 73% to 81%). Quarterly roadmap included specific PLG initiatives, sales comp restructure, and infrastructure optimization.
Distribution / Wholesale
$20M-$1B+ Revenue | Industrial, Food, Medical, Technology
Typical Northstars:
- •Gross Profit / Gross Margin % (45%)
- •Inventory Turns (30%)
- •Fill Rate / Perfect Order % (25%)
Key Causal Drivers:
- Gross Margin % (vendor terms, freight, shrink)
- SKU Count / SKU Profitability
- Inventory Days / Turns
- Warehouse Labor Efficiency
- Customer Concentration
Example Result:
Industrial distributor, $85M revenue
Improved gross margin 3.2 points (from 21.4% to 24.6%)
while reducing stockouts 45% through SKU rationalization (eliminated 1,200 low-velocity SKUs), vendor consolidation (improved terms with top 15 suppliers), and demand forecasting improvements. Year 1 impact: +$2.7M gross profit.
Construction
$15M-$500M+ Revenue | Commercial, Residential, Infrastructure
Typical Northstars:
- •Project Margin % / Operating Profit (50%)
- •Revenue Growth / Backlog Growth (30%)
- •Safety Score / EMR Rating (20%)
Key Causal Drivers:
- Labor Productivity (hours per unit)
- Change Order Management
- Project Duration / Schedule Variance
- Subcontractor Performance
- Materials Waste %
Example Result:
Commercial contractor, $45M revenue
Increased project margin from 6.2% to 7.3% (+18%)
while growing backlog 25% through labor productivity improvements (reduced hours per SF by 12%), change order capture rate improvement (from 62% to 89%), and preconstruction planning optimization. Year 1 impact: +$850K operating profit.
Ecommerce / DTC
$5M-$200M+ Revenue | Direct-to-Consumer & Omnichannel
Typical Northstars:
- •Contribution Margin % / EBITDA (50%)
- •Customer Lifetime Value (LTV) (30%)
- •Conversion Rate / AOV (20%)
Key Causal Drivers:
- CAC by Channel (Facebook, Google, TikTok)
- LTV / CAC Ratio
- Repeat Purchase Rate
- Average Order Value (AOV)
- Return Rate / COGS %
Example Result:
DTC apparel brand, $18M revenue
Improved LTV/CAC from 2.1x to 3.8x (+81%)
while maintaining 35% YoY revenue growth through channel mix optimization (reduced Facebook reliance from 72% to 48%), retention program launch (repeat rate from 18% to 31%), and AOV improvement (upsell/cross-sell optimization). Year 1 impact: Improved unit economics enabled $4M incremental ad spend profitably.
Healthcare Providers
$20M-$500M+ Revenue | Hospitals, Clinics & Healthcare Systems
Typical Northstars:
- •Operating Margin / EBITDA (40%)
- •Patient Satisfaction Score (HCAHPS) (35%)
- •Care Quality Metrics (25%)
Key Causal Drivers:
- Patient Volume & Mix
- Length of Stay (LOS)
- Readmission Rates
- Staff Utilization & Productivity
- Supply Cost per Patient Day
Example Result:
Regional hospital system, $180M revenue
Reduced cost per patient day by $420 (-18%)
while improving HCAHPS scores from 68th to 82nd percentile through staff scheduling optimization (reduced overtime from 14% to 7%), supply chain consolidation (negotiated GPO contracts), and clinical pathway standardization (reduced LOS variability by 22%). Year 1 impact: $7.5M EBITDA improvement + quality score bonuses.
How It Works
From Data to Decisions in Five Steps
Deploy in 60-90 days with minimal disruption to your operations.
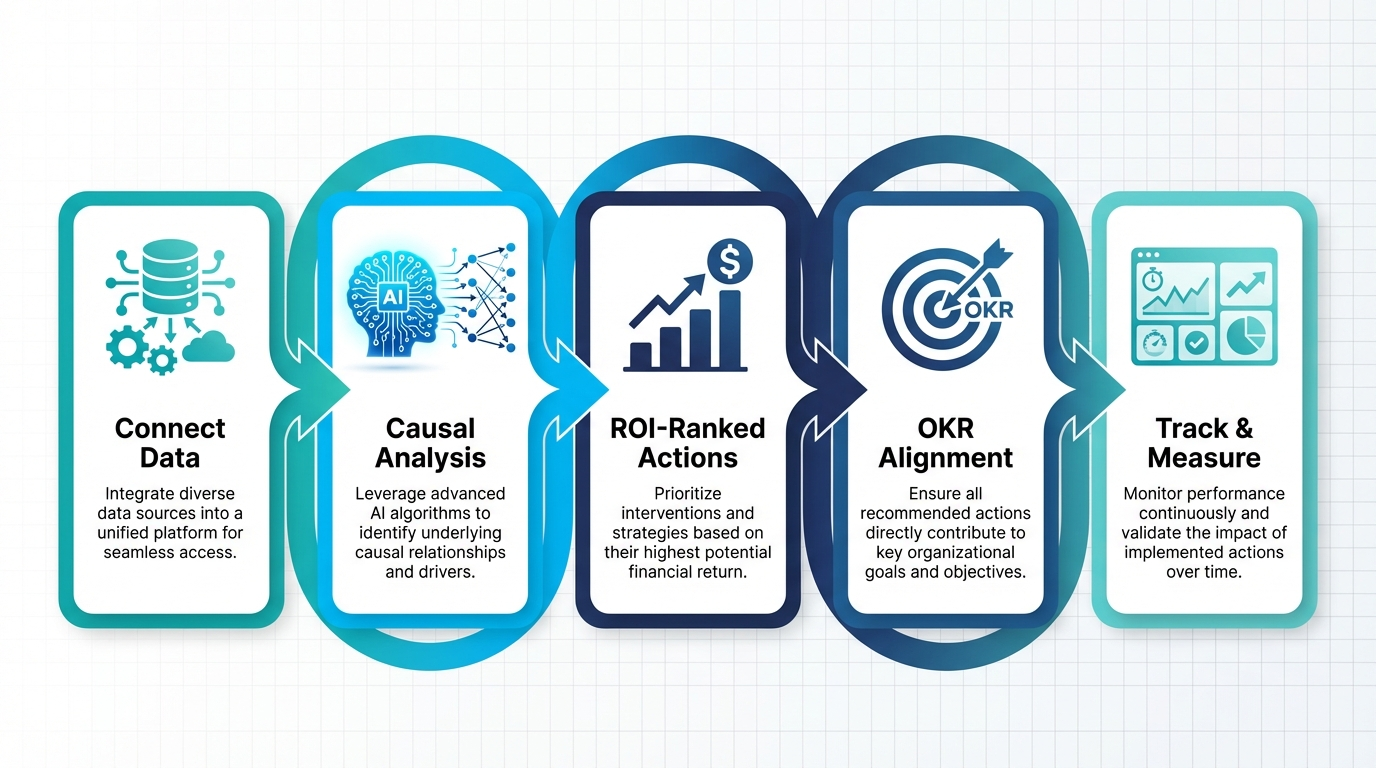
Connect Your Data
Seamlessly integrate with your existing ERP, CRM, and operations systems. No new UI to learn, no process rewrites.
Causal Analysis
Our proprietary AI analyzes relationships between operational metrics and EBITDA outcomes. You will see what drives results and what to do about it.
ROI-Ranked Actions
Receive a prescriptive playbook with specific, ROI-ranked recommendations and expected financial impact.
OKR Alignment
Align teams across functions with causally-linked OKRs that directly support your strategic goals.
Track & Measure
Continuously monitor execution and measure impact with real-time dashboards and leading indicators.
Comparison
Why CausalBeacon?
See how CausalBeacon compares to traditional BI tools and LLM-assisted analytics.
| Feature | Traditional BI (PowerBI, Tableau, NetSuite) | LLM-Assisted (ChatGPT, Claude) | Management Consulting (McKinsey, Bain, BCG) | CausalBeacon Prescriptive Playbook |
|---|---|---|---|---|
| What it shows | What happened | Guesses why | Why + recommendations | Why it happened & what to do |
| Causal analysis | ||||
| Prescriptive actions | Generic advice | Detailed roadmap | Specific, ROI-ranked | |
| Financial impact quantification | Estimated impact | Dollar-term impact | ||
| Team alignment | Static PowerPoint | Causally-linked OKRs | ||
| Implementation time | 6-12 months | Immediate | 8-12 weeks | 60-90 days |
| Cost | $500+/month licenses | $20-200/month per user | $200K-$500K per engagement | $10K+ setup + $1,500/month (up to 25 users as a group) |
Proven Results
Measurable Outcomes Across Industries
Real businesses achieving real results with CausalBeacon. Case studies coming soon.
For CEOs
Turn Operational Complexity Into Your Competitive Edge
Mid-market CEOs face constant pressure: boost EBITDA, cut costs, scale faster—all while navigating messy operations. CausalBeacon is your AI Operating System for measurable outcomes.
Predictable EBITDA Growth
Stop chasing generic "AI transformation." CausalBeacon isolates exactly what drives your EBITDA—then prescribes actions quantified in dollars, not dashboards.
Align Every Initiative to Your North Star
Set your quarterly outcomes (EBITDA, revenue, NPS). CausalBeacon maps every KPI and project to what actually moves the needle—eliminating wasted effort.
Make Decisions 3x Faster
No more debate over what to prioritize. CausalBeacon's counterfactual engine ranks every action by ROI, so your team focuses on what works—backed by data.
From Data Chaos to Clear Action
Your teams drown in dashboards. CausalBeacon connects the dots across operations, finance, and sales—delivering a single source of truth with prescriptive next steps.
CEO
Technology Solutions Provider
"Within 75 days of deploying CausalBeacon, we identified $2.1M in annual EBITDA opportunity. The interactive what-if scenarios alone saved us 40 hours of quarterly planning time."
$2.1M
Annual EBITDA Opportunity Identified
40 hours
Quarterly Planning Time Saved
For Operations Leaders
From Reactive Firefighting to Proactive Optimization
Operations teams drown in data but starve for clarity. CausalBeacon connects the dots across your KPIs—delivering actions that move EBITDA, not just reports.
See the Full Causal Chain
Stop guessing which KPIs matter. CausalBeacon maps the actual relationships between metrics—showing you what drives outcomes, not just correlations.
Prescriptive Actions, Not Just Insights
Traditional BI tells you "what happened." CausalBeacon tells you "do this next"—with counterfactual analysis proving what works before you commit resources.
Track Every Initiative to EBITDA
Align cross-functional teams around a single north star. CausalBeacon creates a balanced scorecard that connects daily operations to quarterly outcomes—no more siloed metrics.
Identify Problems Before They Escalate
Real-time monitoring with causal reasoning spots early warning signs. Get alerts when leading indicators shift—so you fix issues before they hit your bottom line.
VP Operations
Specialty Manufacturing Company
"We used to debate which projects to prioritize for weeks. CausalBeacon showed us the causal chain from shop floor metrics to EBITDA—now planning cycles are 60% faster and we've saved 2,000+ hours."
60%
Faster Planning Cycles
2,000+
Hours Saved Annually
Estimate Your EBITDA Opportunity
See what companies like yours typically achieve with CausalBeacon
$2,000,000
Estimated EBITDA Lift
Based on 2% avg improvement
4-8x
Typical ROI Multiple
Within 12-24 months
60-90
Days to Deploy
Minimal team commitment
Free 30-minute discovery call • No obligation
*Estimates based on average results from mid-market manufacturing and professional services companies
Seamless Integration with Your Existing Stack
CausalBeacon connects directly to your ERP, CRM, and data platforms—no complex migration needed.

ERP

ERP

ERP

CRM

Analytics

Analytics

Cloud

Cloud

Cloud

Data

ERP

ERP

Enterprise

Healthcare

Healthcare
+ 50 more integrations via API connectors
About the Technology
Proprietary AI That Connects Operations to EBITDA
CausalBeacon is built on proprietary AI technology that connects operational metrics to financial outcomes. Our causal analysis engine identifies true drivers of EBITDA—not just correlations—and prescribes ROI-ranked actions specific to your business.
Built for Mid-Market Growth
CausalBeacon is an enterprise-grade AI system designed to empower mid-market businesses to optimize workflows, maximize profitability, and achieve measurable outcomes. We move businesses beyond descriptive analytics into prescriptive, action-oriented intelligence.
Transform raw data into measurable business outcomes
1.5-3% EBITDA growth without adding headcount
60-90 days, minimal team commitment
Follow us on LinkedIn for weekly insights on causal analysis, EBITDA optimization, and manufacturing excellence.
Follow CausalBeacon on LinkedInGet Started
See CausalBeacon in Action
Discover how mid-market companies are achieving 1.5-3% EBITDA growth with prescriptive actions backed by causal AI.
Ready to Transform Your Data into Decisions?
Join leading mid-market businesses achieving 1.5-3% EBITDA improvement with CausalBeacon. Our team will walk you through:
- How CausalBeacon identifies the true drivers of your KPIs
- ROI-ranked action plans specific to your business
- 60-90 day deployment timeline and expected outcomes
Contact Information
CausalBeacon: Choose Your Northstars. Get Your Two-Year Roadmap. Know Who Does What Weekly.
Optimize any metric combination. Balance competing goals. Across any for-profit business.
Consulting-grade causal analysis at software-scale economics.